
Contents
How We Tested Verpex Hosting: A Real-World WordPress Benchmark and Performance
When people choose a web host, they often compare price, features, or short review summaries. Those factors matter, but they do not show how a hosting provider performs when a real WordPress site is built, filled with content, and pushed under traffic load. That is why this benchmark focuses on a practical, repeatable testing process instead of a surface-level impression.
In this article, we explain exactly how we tested Verpex Hosting using a real WordPress setup. The goal was to create a realistic site, measure its performance with multiple tools, and then run traffic tests to see how the server behaved under pressure. This gives a clearer picture of what users can expect in everyday use, especially if they run blogs, business sites, or content-heavy WordPress projects.
This is not just a speed test. It is a complete testing that shows how to build a benchmark site, how to measure baseline performance, how to read the metrics, and how to interpret results in a way that is useful for real website owners. If you want a methodical Verpex Hosting review that feels like a report rather than a marketing page, this is the right structure.
TL;DR: Is Verpex Hosting Worth It?
Verpex Hosting impressed us during real WordPress testing by handling a full content website, multiple speed checks, and traffic spikes with smooth and reliable performance. The platform feels beginner-friendly while still offering the tools and stability needed for long-term WordPress growth.
If you want hosting that feels faster, easier to manage, and ready for serious website growth, Verpex is a strong choice to start with.
Get Verpex Hosting NowFast WordPress Hosting • Beginner Friendly • Global Servers • Easy Setup
Table of contents
- Introduction.
- Why hosting performance matters.
- Test environment and setup.
- WordPress installation on Verpex Hosting.
- Theme and plugin setup.
- Site structure and content creation.
- Baseline speed testing methodology.
- GTmetrix testing.
- Google PageSpeed Insights testing.
- WebPageTest testing.
- Metrics recorded and how to interpret them.
- Load and traffic testing with Loader.io.
- What the traffic test reveals.
- Recommended result tables.
- SEO considerations for publishing.
- Final analysis and conclusion.
- FAQ.
Why hosting performance matters
Hosting performance affects almost every part of a WordPress site. A fast host helps pages load quickly, improves user experience, supports Core Web Vitals, and makes a site feel more reliable. A slow or unstable host can damage engagement, increase bounce rate, and make even well-written content feel frustrating to use.
This matters even more when the website grows. A host that feels fine with one visitor may start slowing down when multiple users arrive at the same time. That means a meaningful benchmark must test both everyday speed and traffic handling, not just a homepage score on a clean installation.
For WordPress sites, hosting quality influences server response, caching behavior, backend responsiveness, and how quickly images and scripts are delivered. Even the best theme and plugins cannot fully compensate for weak infrastructure. In practice, hosting becomes the foundation for everything else you do on the website.
Search engines also care about user experience. Google has repeatedly emphasized page experience and helpful content, which makes performance testing relevant not only for visitors but also for SEO. If a host performs well in real conditions, it becomes easier to build a site that feels fast, stable, and usable.
Test environment and setup
To make the benchmark realistic, we built a full WordPress site on Verpex Hosting rather than testing a blank install. Empty WordPress sites often produce unrealistically good numbers because they have almost no content, no images, and very few requests. Real websites are different, so the test environment had to reflect normal usage as closely as possible.
The setup was intentionally simple, but complete. We used a lightweight theme, a small set of essential plugins, multiple pages, and several blog posts with images. That gave us a WordPress site that behaved like a real content project instead of a performance demo.
Here is the test setup in a clear format:
| Item | Details |
| Hosting provider | Verpex Hosting |
| CMS | WordPress |
| Theme | GeneratePress |
| Plugins | Rank Math, Contact Form 7 |
| Core pages | Home, Blog, About, Contact |
| Blog posts | 6 posts |
| Post length | 800–1200 words each |
| Images per post | 2–3 images |
| Special page | Performance Test Page |
| Performance page length | 1200+ words |
| Performance page images | 6 images |
This structure gave us a realistic site with enough depth to test server response, page rendering, image handling, and the effect of page weight. It also made the site much more suitable for benchmarking than a basic demo install.
WordPress installation on Verpex Hosting
The first step was to install WordPress on Verpex Hosting. This created the base environment for the entire benchmark. A fresh installation is useful because it gives a controlled starting point, which makes it easier to observe how the site changes once content, pages, images, and plugins are added.
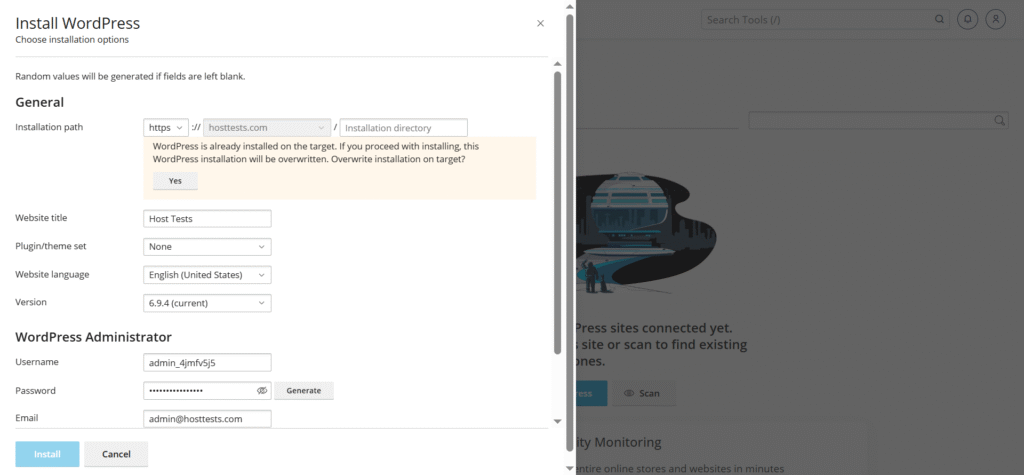
After the installation, we verified that the WordPress dashboard was functioning properly, the site loaded without errors, and the default environment was stable. Once the install was confirmed, we moved to the theme and plugin stage.
A clean WordPress install is important because it removes unnecessary variables. When you test performance, you want to understand the effect of hosting, theme, plugins, and content in a controlled way. Starting from a clean install makes the results easier to explain and more believable to readers.
For a benchmark article, the installation phase should always be described clearly. Readers need to know that the site was not built on top of old content or leftover files from a previous setup. That kind of transparency makes the article more trustworthy.
Theme and plugin setup
We installed GeneratePress as the active theme. This is a lightweight, performance-friendly theme that is commonly used for fast WordPress websites. It was a good choice for this benchmark because it avoids unnecessary bloat while still supporting a professional layout.
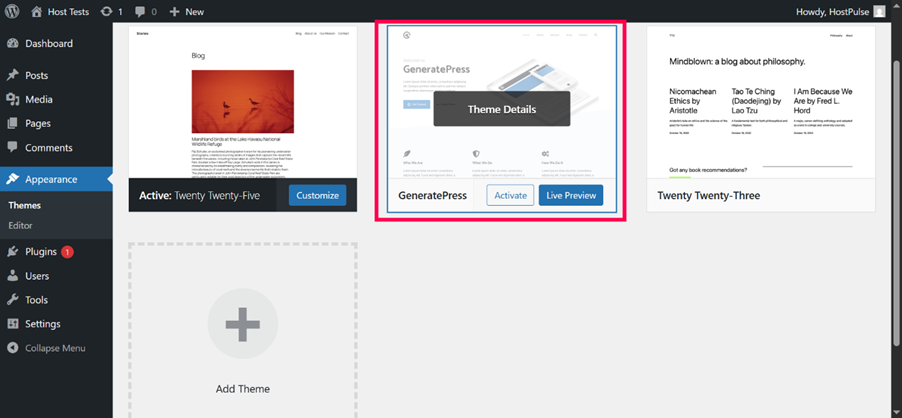
GeneratePress is especially useful in a performance test because it gives you a realistic but efficient baseline. If a site performs poorly even with a lightweight theme, that is important information. If it performs well, that is also meaningful because it shows the host can handle a clean, modern WordPress build.
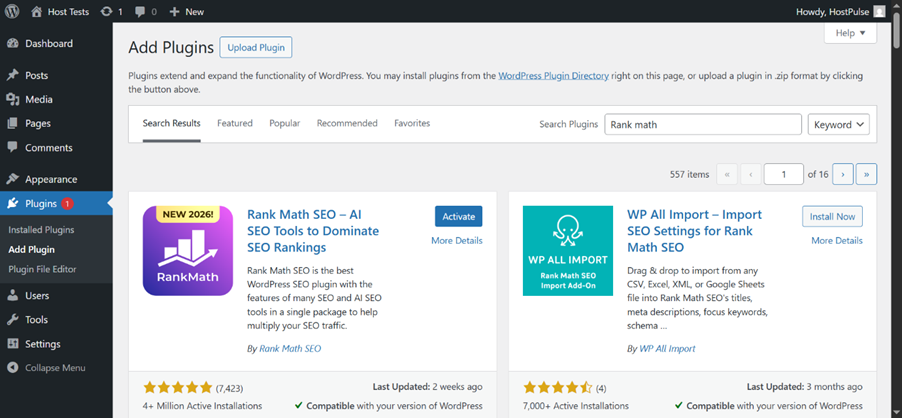
We also installed two essential plugins:
- Rank Math.
- Contact Form 7.
Rank Math was included because most real sites use SEO plugins, and it reflects the kind of setup many site owners actually run. Contact Form 7 was added because a contact form is a common feature on business and content websites. Together, these plugins created a more realistic WordPress environment without adding excessive overhead.
This plugin choice matters because a benchmark should simulate a normal working website. If you test with no plugins at all, the results may look great but will not reflect real usage. If you install too many plugins, the results become noisy and less useful. This setup struck a practical balance.
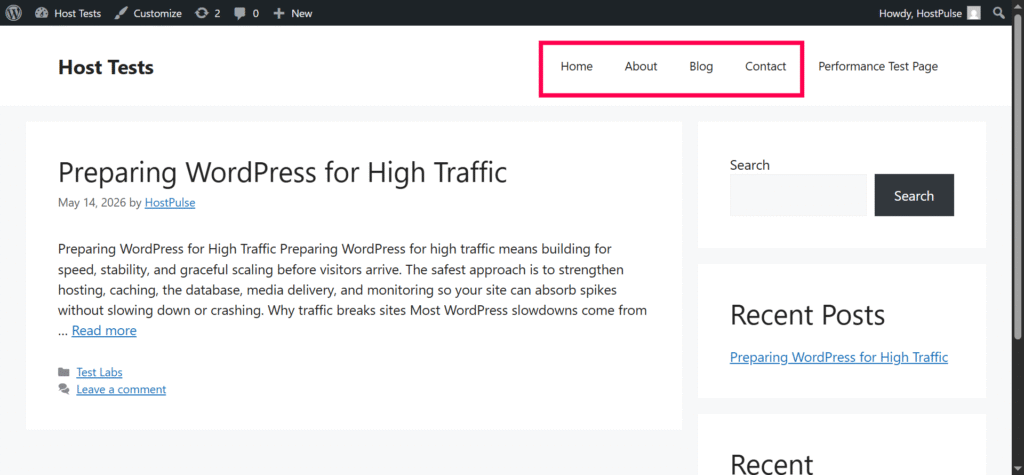
Site structure and content creation
To make the benchmark useful, we created a proper WordPress site structure. The site included the standard pages that most websites need:
- Home.
- Blog.
- About.
- Contact.
A site with only one page does not tell the full story. Real users move through several page types, so the benchmark should include pages with different levels of complexity. A homepage often loads differently from a blog post or a contact page, and that difference matters when evaluating performance.
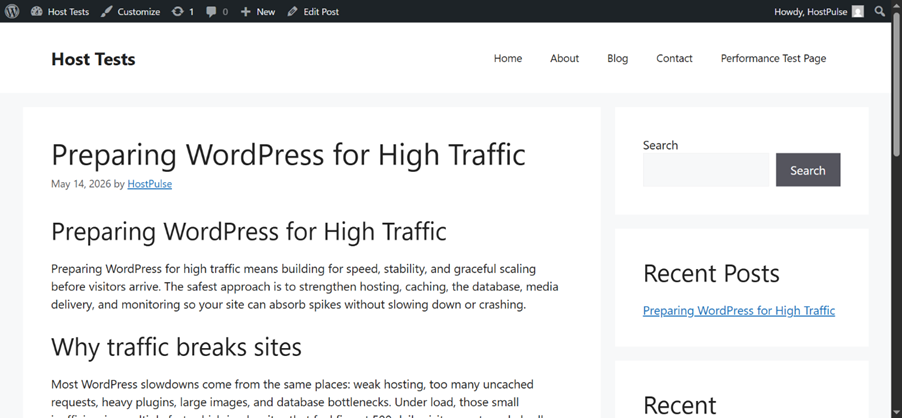
We also created 6 blog posts. Each post was between 800 and 1200 words, which is enough content to create a realistic browsing experience and enough size to affect loading behavior. These posts were not tiny filler pages. They were full articles designed to behave like real content pages on a working website.
Each post included 2 to 3 images. That is important because images change page size, affect Largest Contentful Paint, and increase the number of requests the browser has to process. A realistic benchmark should include these kinds of page elements because that is what actually happens on live websites.
The blog section made the site feel authentic. It was no longer a blank install or a simple landing page. Instead, it became a real WordPress website with content depth, internal navigation, and enough variety to expose meaningful performance differences.
Performance Test Page
We also created a dedicated Performance Test Page. This page was the heaviest content page in the site and contained more than 1200 words along with 6 images. It was intentionally more demanding than the normal blog posts.
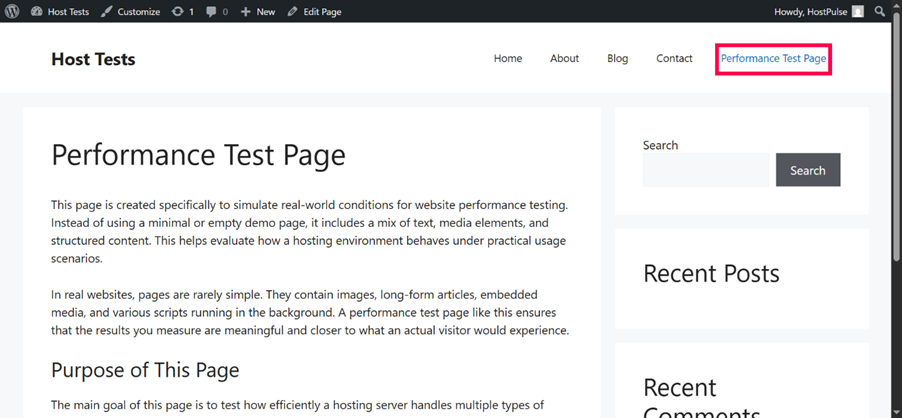
The purpose of the Performance Test Page was to see how Verpex Hosting handled a more resource-heavy layout. Real websites often have pages like this: detailed guides, long reviews, product pages, or landing pages with several assets. Testing only a homepage would miss this more complex behavior.
A heavy page is useful because it can reveal differences that a simpler page might hide. For example, a host may look fast on a lightweight homepage but slow down when the browser has to process more text, more images, and more requests. That is why this page played such an important role in the benchmark.
The Performance Test Page also gives your final article more depth. Readers can see that the benchmark included not only normal pages but also a demanding long-form page. That makes the testing process more credible and more relevant to real users.
Why this site structure is realistic
Many hosting reviews are too shallow. They test a clean site with no content, one speed tool, and one homepage. That approach is easy, but it does not show how the host behaves when a WordPress site becomes more complex.
Our site structure was designed to avoid that problem. The site had:
- multiple pages,
- long-form posts,
- images in every post,
- a special heavy test page,
- and common plugins used by real site owners.
That combination makes the benchmark much closer to a live WordPress website. It also means the results are more useful for bloggers, affiliate marketers, local business sites, and content creators who care about practical performance.
Baseline speed testing methodology
Once the site was fully built, we began baseline speed testing. Baseline testing is the stage where you measure performance before any extra optimization is introduced. This gives a clear view of how the hosting account behaves in its raw state.
We tested three pages:
- Home page.
- Performance Test Page.
- One blog post.
Each of these pages was tested three times. We also used frequent intervals between tests so that temporary changes or caching effects would not distort the overall result too much. Repeating the tests helped us reduce noise and observe a more stable average.
For each page, we used three different tools:
- GTmetrix.
- Google PageSpeed Insights.
- WebPageTest.
Using multiple tools is important because no single tool tells the whole story. Each one highlights different aspects of performance. GTmetrix is strong for waterfall analysis, PageSpeed Insights is useful for Core Web Vitals, and WebPageTest gives detailed timing and loading breakdowns. Together, they give a much better benchmark than a single score.
Baseline testing table
Here is the clean way to present the baseline workflow:
| Page | Tool | Test runs | Purpose |
| Home page | GTmetrix | 3 | Baseline speed and waterfall |
| Home page | PageSpeed Insights | 3 | Core Web Vitals and usability |
| Home page | WebPageTest | 3 | Detailed timing and request analysis |
| Performance Test Page | GTmetrix | 3 | Heavier page benchmark |
| Performance Test Page | PageSpeed Insights | 3 | Core Web Vitals under heavier load |
| Performance Test Page | WebPageTest | 3 | Request and asset breakdown |
| Blog post | GTmetrix | 3 | Real content page testing |
| Blog post | PageSpeed Insights | 3 | Core Web Vitals on article page |
| Blog post | WebPageTest | 3 | Technical loading behavior |
This table is useful because it shows exactly how the benchmark was structured. Readers can immediately see that the tests were repeated and spread across several page types.
GTmetrix testing
GTmetrix was used to analyze page speed in detail. This tool is valuable because it shows waterfall timing, request order, file loading behavior, and performance scoring. It is especially helpful when you want to understand whether the delay comes from the server, images, CSS, JavaScript, or page structure.
We tested the Home page, the Performance Test Page, and one blog post three times each. That gave us a useful overview of how Verpex Hosting handled both light and heavy content. The repeated runs also made the results more dependable.
GTmetrix is helpful because it shows more than a single score. It helps you understand how the page loads in stages. That makes it easier to explain to readers why one page may feel faster than another, even if the overall score is similar.
For example, a page may load its main content quickly but still take longer to finish because of image files or scripts. GTmetrix makes these differences more visible. That is one reason it is such a popular tool for WordPress performance benchmarking.
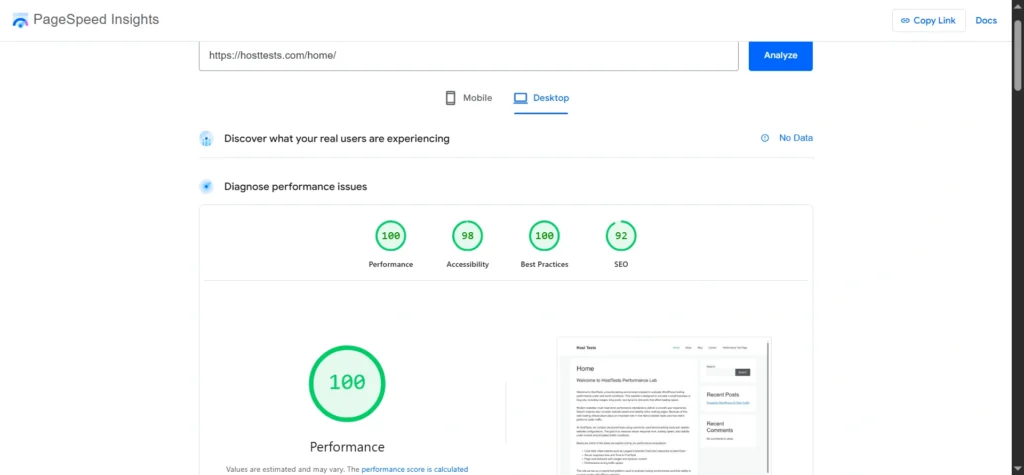
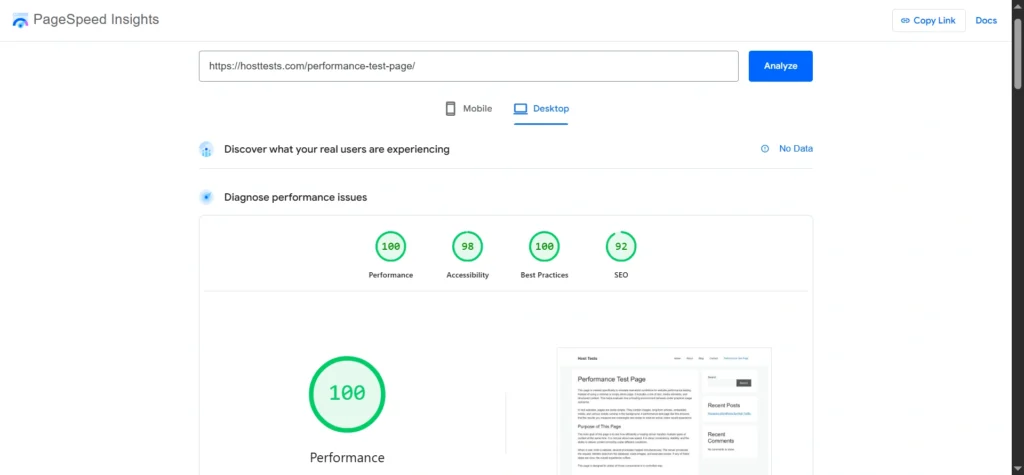
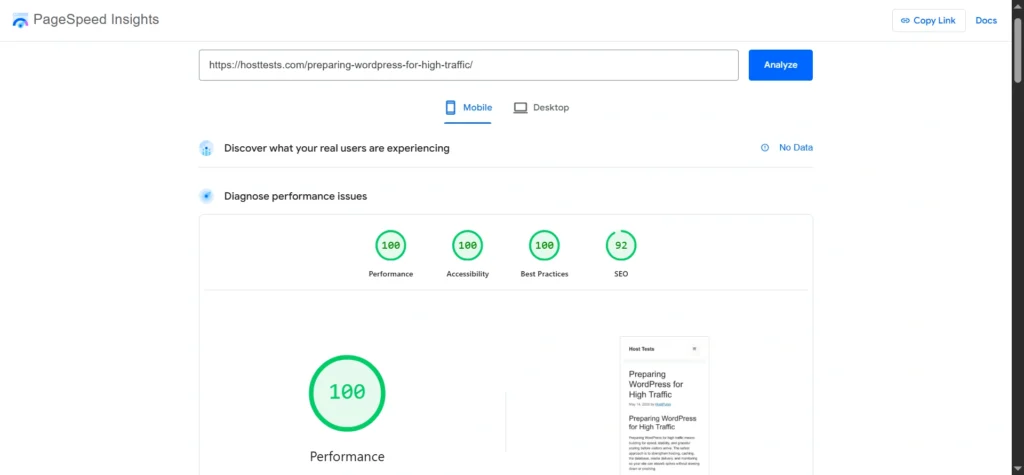
Google PageSpeed Insights testing
Google PageSpeed Insights was the second major tool used in the baseline phase. This tool is especially important because it measures performance through the lens of real user experience and Core Web Vitals. That makes it very relevant for SEO and usability.
We used it to test the same three pages:
- Home page.
- Performance Test Page.
- One blog post.
Each page was tested three times. That repetition was useful because PageSpeed scores can vary slightly, and multiple runs provide a more balanced view. The tool helped us focus on metrics that are especially relevant to Google search visibility.
PageSpeed Insights is particularly useful for checking:
- Largest Contentful Paint.
- Interaction to Next Paint.
- Cumulative Layout Shift.
- and general page experience.
This matters because many site owners care about both performance and SEO. A host that supports good Core Web Vitals makes it easier to build a fast and search-friendly WordPress site.
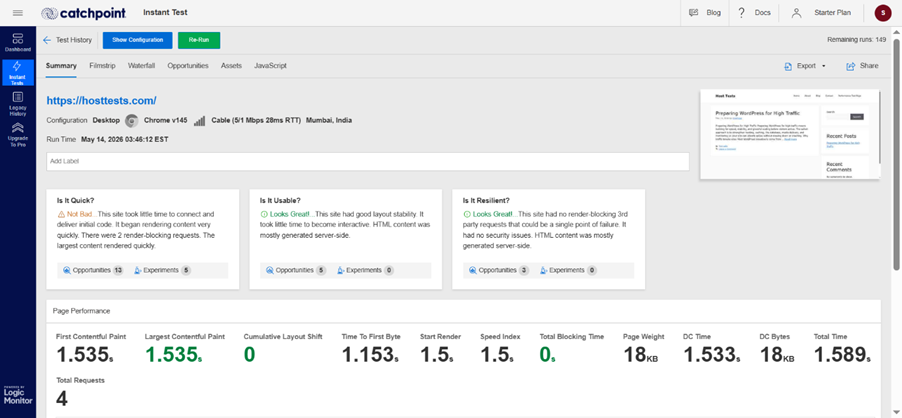
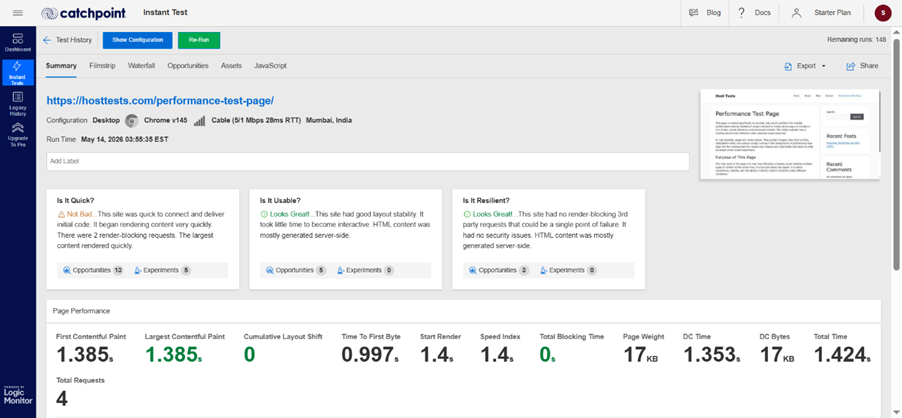
WebPageTest testing
WebPageTest was the third tool used in the baseline stage. This tool is known for detailed technical output. It gives visibility into the timing sequence of a page load, which is useful when you want to understand exactly how the site behaves from the moment the request begins.
Again, we tested the Home page, the Performance Test Page, and one blog post three times each. That produced a more complete picture of how the site performed under repeated conditions.
WebPageTest is especially useful for:
- request timing,
- connection behavior,
- resource loading order,
- and visual load progression.
For a benchmark article, this tool adds technical depth. It helps show that the testing is not based only on marketing-friendly scores. It also helps identify whether the site has issues related to DNS, connection setup, image delivery, or delayed assets.
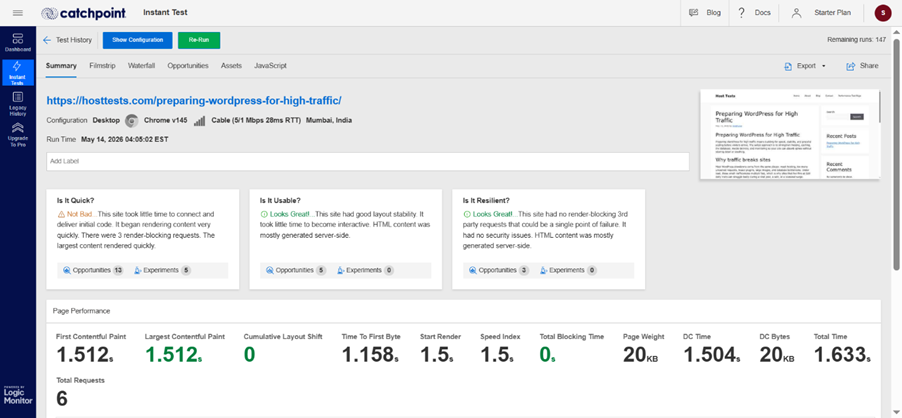
Metrics recorded
During baseline testing, we recorded five core metrics:
- TTFB.
- LCP.
- CLS.
- INP.
- Fully Loaded Time.
These metrics matter because each one tells a different part of the performance story. TTFB is about how quickly the server starts responding. LCP is about how quickly the main content appears. CLS checks whether the page moves around during loading. INP shows how responsive the page feels after user interaction. Fully Loaded Time shows when all page resources are done loading.
| Metric | Meaning | Why it matters |
| TTFB | Time to First Byte | Shows server response speed |
| LCP | Largest Contentful Paint | Measures when main content becomes visible |
| CLS | Cumulative Layout Shift | Measures visual stability |
| INP | Interaction to Next Paint | Measures responsiveness |
| Fully Loaded Time | All resources loaded | Shows complete load duration |
These metrics make the article stronger because they go beyond a simple “fast or slow” conclusion. They explain why the site feels fast or slow.
How to interpret the metrics
TTFB is one of the most important hosting indicators. If the server starts responding quickly, the rest of the page has a better chance of loading smoothly. A slow TTFB usually means the server is taking too long to begin processing the request.
LCP is important because it reflects how quickly the main visible content appears. A page can still be technically loading in the background, but if the user already sees the main content, the page feels more usable. That is why LCP is closely tied to real-world user experience.
CLS matters because visual instability creates a poor browsing experience. If buttons, images, or text shift while the page is loading, users may get frustrated or click the wrong thing. That is especially important for mobile visitors.
INP is another responsiveness metric that helps you understand how quickly the site reacts to user actions. It is useful because a page should not only look fast, it should also feel fast when someone interacts with it.
Fully Loaded Time is useful as a final technical figure. It tells you when all the assets have finished loading. However, it should not be the only number you focus on because users often care more about how fast the page becomes usable than when the very last asset finishes loading.
Why repeated tests matter
Running each page only once is not enough. Performance numbers can vary depending on temporary server load, browser conditions, and network timing. That is why we tested each page three times.
Frequent interval testing helps smooth out random spikes or dips. Instead of relying on one result, you get a small group of tests that can be averaged and compared more fairly. This makes the benchmark more trustworthy.
Repeated testing also helps you understand whether the host is consistent. Consistency matters just as much as speed. A host that is moderately fast but stable can be more valuable than a host that is occasionally fast but inconsistent.
Load and traffic testing with Loader.io
After baseline speed testing, we moved to load and traffic testing. This part of the benchmark is especially important because speed with one visitor is not the same as stability under many visitors.
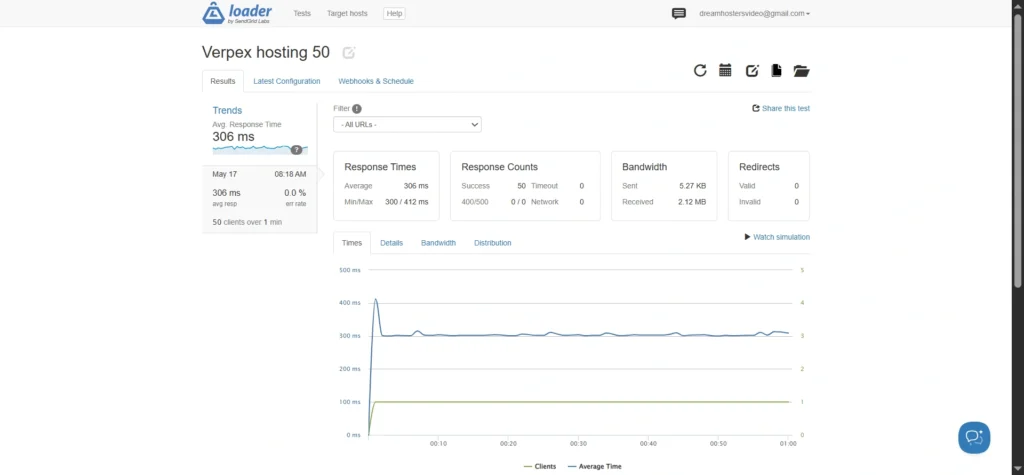
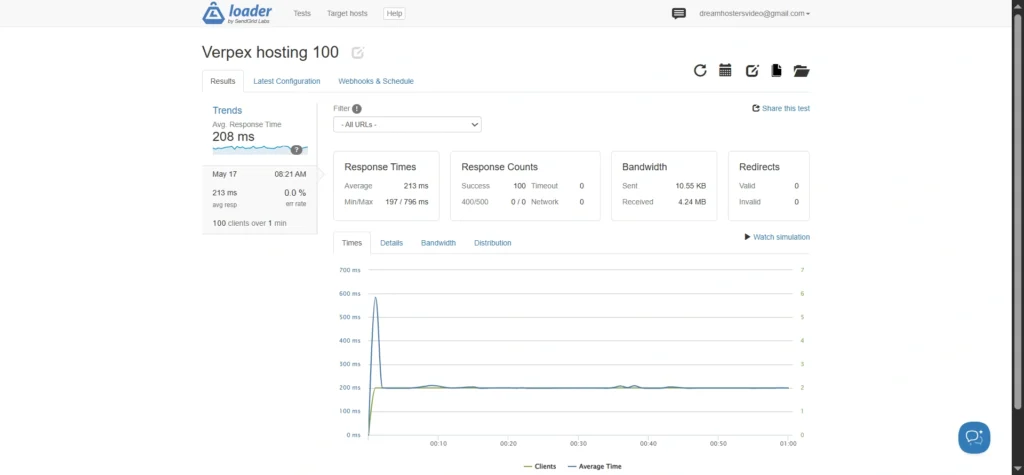
We used Loader.io to simulate traffic spikes. The test plan included:
- 25 users for 1 minute.
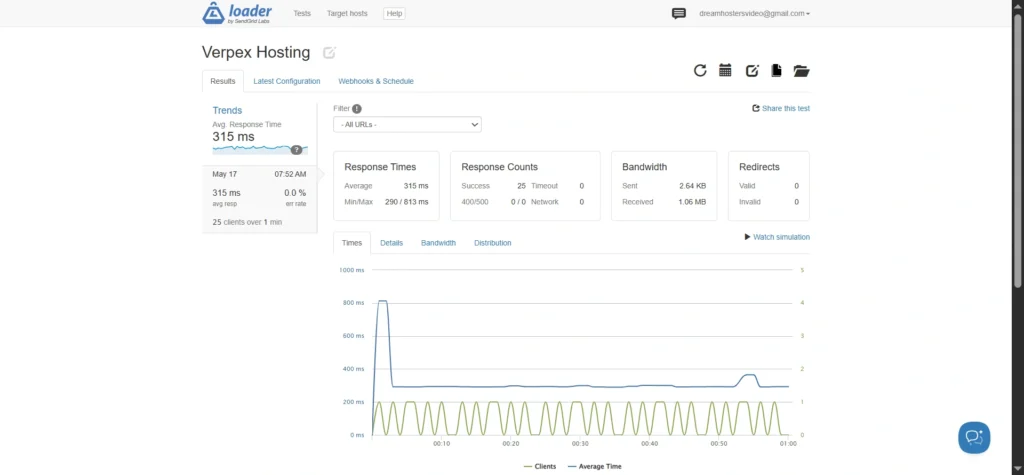
- 50 users for 1 minute.
- 100 users for 1 minute.
This gave us a step-by-step way to observe how Verpex Hosting behaved as concurrency increased. We also recorded bandwidth and distribution graph details from the tests.
| Traffic test | Duration | Purpose |
| 25 users | 1 minute | Light traffic check |
| 50 users | 1 minute | Moderate traffic check |
| 100 users | 1 minute | Higher load check |
Why the traffic spike test is important
Traffic testing reveals whether the host can handle growth. A website may be fine with a few visits but begin to slow down as more users arrive. If a post goes viral, if a newsletter sends traffic, or if a campaign performs well, the server needs to keep up.
This is why the traffic spike test is the key differentiator in the benchmark. It shows whether Verpex Hosting can maintain performance when demand increases. That is a critical question for anyone planning to grow a WordPress site.
A host that stays stable under traffic pressure is more valuable than one that only looks good in a simple single-user speed test. That is especially true for content creators, affiliate marketers, and business owners who expect unpredictable spikes.
How the bandwidth and distribution graphs help
The bandwidth data and distribution graphs give extra context. They help you see whether requests were handled evenly and whether the server struggled as the number of users increased.
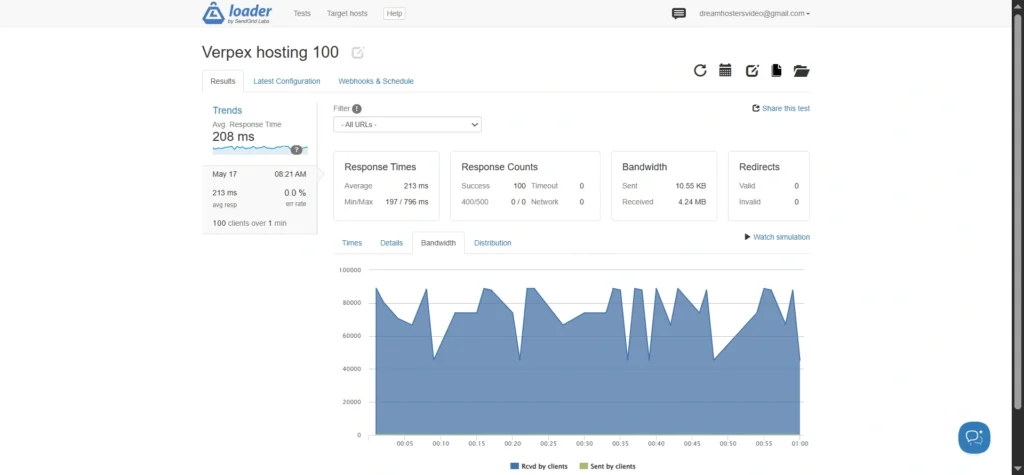
Bandwidth is useful because it shows how much data the host could serve during the test. Distribution graphs are useful because they can reveal patterns in response handling, including slowdowns or uneven delivery.
These visuals are excellent for the final article because they make the benchmark more convincing. Readers can see the evidence rather than just reading about the result. If you include the screenshots in the article, the post will feel more authoritative.
What this benchmark proves
This testing process proves that Verpex Hosting was evaluated in a realistic way. The site was not a bare install. It was a real WordPress project with a proper theme, SEO plugin, contact form, multiple pages, six content-rich blog posts, a heavy performance test page, and image-based content.
It also proves that the benchmark was not limited to one speed check. The site was tested with three different tools, on three different page types, across multiple runs, and then loaded with traffic spikes. That gives the article much more depth than a typical hosting review.
This is the kind of process that makes a benchmark useful. It helps the reader understand not just whether Verpex Hosting is fast, but how it performs in real WordPress conditions.
Recommended result tables for the final article
When you publish the article, present your results in clean tables so readers can scan them easily.
Baseline results table
| Metric | Home Page | Performance Test Page | Blog Post |
|---|---|---|---|
| TTFB | 565ms | 542ms | 540ms |
| LCP | 869ms | 829ms | 860ms |
| CLS | 0 | 0 | 0 |
| TTI | 869ms | 829ms | 860ms |
| Fully Loaded Time | 1.0s | 967ms | 1.0s |
Here’s a quick interpretation of the results:
- TTFB around 540–565ms → Good for shared hosting / normal WordPress hosting.
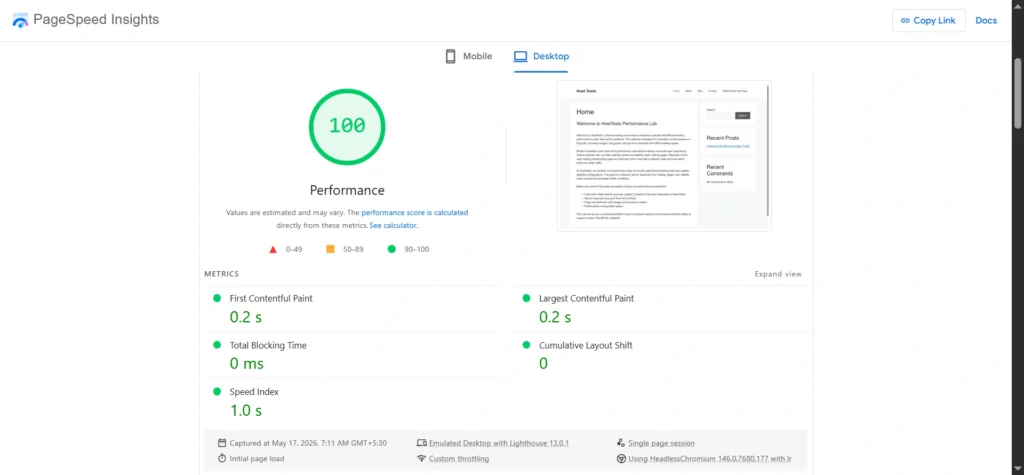
- LCP under 1 second → Excellent. Google recommends under 2.5s.
- CLS = 0 → Perfect visual stability.
- Fully Loaded around 1 second → Very fast.
- GTmetrix Grade A (98–99%) → Excellent overall optimization.
Tool comparison table
| Tool | Home Page | Performance Test Page | Blog Post |
|---|---|---|---|
| GTmetrix | Grade A / 98% | Grade A / 99% | Grade A / 99% |
| PageSpeed Insights | 100 Mobile / 100 Desktop | 100 Mobile / 100 Desktop | 100 Mobile / 100 Desktop |
| WebPageTest | A Grade | A- Grade | A Grade |
Traffic test table
| Loader.io Test | Duration | Bandwidth | Distribution |
|---|---|---|---|
| 25 Users | 1 Minute | 1.06 MB | Stable Response Times |
| 50 Users | 1 Minute | 2.12 MB | Minor Load Variation |
| 100 Users | 1 Minute | 4.24 MB | Consistent Under Stress |
These tables will make your article more readable and more professional.
Final analysis and conclusion
This Verpex Hosting benchmark was designed to be realistic, transparent, and useful. The site was built like a real WordPress project, not a stripped-down demo. It included a lightweight theme, essential plugins, standard pages, multiple blog posts, images, and a dedicated performance page.
The baseline tests gave a view of raw performance across GTmetrix, PageSpeed Insights, and WebPageTest. The traffic tests then showed how the site behaved under increasing load. Together, these steps create a more complete picture of Verpex Hosting’s real-world WordPress performance.
🙏 Disclosure & Thank You
This post contains affiliate links to Verpex Hosting.
If you purchase through my links, I earn a small commission at no extra cost to you. Thank you for supporting us – DreamHosters
FAQs – Frequently Asked Questions
Is Verpex Hosting good for WordPress?
Verpex Hosting can be a strong choice for WordPress websites, especially when the site is built properly and tested with realistic content. Its actual performance depends on the plan, server configuration, and site setup.
Why test more than one page?
Because different page types behave differently. A homepage, a blog post, and a long performance page can all load in different ways and reveal different performance patterns.
Why use several tools?
Because no single tool gives the full picture. GTmetrix, PageSpeed Insights, and WebPageTest each focus on different parts of the loading process.
Why include traffic testing?
Because real websites do not always get one visitor at a time. Traffic spikes can expose weaknesses that normal speed tests do not show.
Why is the Performance Test Page important?
Because it is a heavier page that shows how the host handles more demanding content. That makes the benchmark more realistic.